Add Text to a ggplot2 Plot Indicating the Results of a Hypothesis Test
stat_test_text.RdFor a strip plot or scatterplot produced using the package ggplot2
(e.g., with geom_point),
add text indicating the results of a hypothesis test comparing locations
betweeen groups, where the groups are defined based on the unique \(x\)-values.
stat_test_text(mapping = NULL, data = NULL,
    geom = ifelse(text.box, "label", "text"), position = "identity",
    na.rm = FALSE, show.legend = NA, inherit.aes = TRUE,
    y.pos = NULL, y.expand.factor = 0.35, test = "parametric",
    paired = FALSE, test.arg.list = list(), two.lines = TRUE,
    p.value.digits = 3, p.value.digit.type = "round",
    location.digits = 1, location.digit.type = "round",
    nsmall = ifelse(location.digit.type == "round", location.digits, 0),
    text.box = FALSE, alpha = 1, angle = 0, color = "black",
    family = "", fontface = "plain", hjust = 0.5,
    label.padding = ggplot2::unit(0.25, "lines"),
    label.r = ggplot2::unit(0.15, "lines"), label.size = 0.25,
    lineheight = 1.2, size = 4, vjust = 0.5, ...)
Arguments
- mapping, data, position, na.rm, show.legend, inherit.aes
See the help file for
geom_text.- geom
Character string indicating which
geomto use to display the text. Settinggeom="text"will usegeom_textto display the text, and settinggeom="label"will usegeom_labelto display the text. The default value isgeom="text"unless the user setstext.box=TRUE.- y.pos
Numeric scalar indicating the \(y\)-position of the text (i.e., the value of the argument
ythat will be used in the call togeom_textorgeom_label). The default value isy.pos=NULL, in which casey.posis set to the maximum value of all \(y\)-values plus a proportion of the range of all \(y\)-values, where the proportion is determined by the argumenty.expand.factor(see below).- y.expand.factor
For the case when
y.pos=NULL, a numeric scalar indicating the proportion by which the range of all \(y\)-values should be multiplied by before adding this value to the maximum value of all \(y\)-values in order to compute the value of the argumenty.pos(see above). The default value isy.expand.factor=0.35.- test
A character string indicating whether to use a standard parametric test (
test="parametric", the default) or nonparametric test (test="nonparametric") to compare groups.- paired
For the case of two groups, a logical scalar indicating whether the data should be considered to be paired. The default value is
paired=FALSE.NOTE: if the argument
test.arg.listis supplied and it includes a component namedpaired, the value of that component is overriden by the value of the argumentpaired.- test.arg.list
An optional list of arguments to pass to the function used to test for group differences in location. The default value is an empty list:
test.arg.list=list(). In particular, when there are two groups,ci.and.test="parametric", andci.arg.listdoes not contain a component specifying the value forvar.equal, this argument is updated to include the componentvar.equal=TRUE, which is not the default behavior oft.test.NOTE: If
test.arg.listcontains a component named"paired", the value of that component is set to the value of the argumentpaired(see above).- two.lines
For the case of one or two groups, a logical scalar indicating whether the associated confidence interval should be be displayed on a second line instead of on the same line as the p-value. The default is
two.lines=TRUE.- p.value.digits
An integer indicating the number of digits to use for displaying the p-value. When
p.value.digit.type="round"(see below) the argumentp.value.digitsindicates the number of digits to round to, and whenp.value.digit.type="signif"the argumentp.value.digitsindicates the number of significant digits to display. The default value isp.value.digits=3.- p.value.digit.type
A character string indicating whether the
p.value.digitsargument (see above) refers to significant digits (p.value.digit.type="signif"), or how many decimal places to round to (p.value.digit.type="round", the default).- location.digits
For the case of one or two groups, an integer indicating the number of digits to use for displaying the associated confidence interval. When
location.digit.type="round"(see below) the argumentlocation.digitsindicates the number of digits to round to, and whenlocation.digit.type="signif"the argumentlocation.digitsindicates the number of significant digits to display. The default value islocation.digits=1.- location.digit.type
For the case of one or two groups, a character string indicating whether the
location.digitsargument (see above) refers to significant digits
(location.digit.type="signif"), or how many decimal places to round to (location.digit.type="round"; the default).- nsmall
For the case of one or two groups, an integer passed to the function
formatindicating the the minimum number of digits to use to the right of the decimal point for the associated confidence interval. The default value isnsmall=digitswhendigit.type="round"andnsmall=0whendigit.type="signif". Whennsmallis greater than 0, the two confidence limits will have the same number of digits to the right of the decimal point (including, possibly, trailing zeros). To omit trailing zeros, setnsmall=0.- text.box
Logical scalar indicating whether to surround the text with a text box (i.e., whether to use
geom_labelinstead ofgeom_text). This argument can be overridden by simply specifying the argumentgeom.- alpha, angle, color, family, fontface, hjust, vjust, lineheight, size
See the help file for
geom_textand the vignette Aesthetic specifications at https://cran.r-project.org/package=ggplot2/vignettes/ggplot2-specs.html.- label.padding, label.r, label.size
See the help file for
geom_text.- ...
Other arguments passed on to
layer.
Details
The table below shows which hypothesis tests are performed based on the number of groups
and the values of the arguments test and paired.
| Function | ||||
| # Groups | test | paired | Name | Called |
| 1 | "parametric" | One-Sample t-test | t.test | |
"nonparametric" | Wilcoxon Signed Rank Test | wilcox.test | ||
| 2 | "parametric" | FALSE | Two-Sample t-test | t.test |
TRUE | Paired t-test | t.test | ||
"nonparametric" | FALSE | Wilcoxon Rank Sum Test | wilcox.test | |
TRUE | Wilcoxon Signed Rank Test | wilcox.test | ||
| on Paired Differences | ||||
| \(\ge\) 3 | "parametric" | Analysis of Variance | aov | |
summary.aov | ||||
"nonparametric" | Kruskal-Wallis Test | kruskal.test |
See the help file for geom_text for details about how
geom_text and geom_label work.
See the vignette Extending ggplot2 at https://cran.r-project.org/package=ggplot2/vignettes/extending-ggplot2.html for information on how to create a new stat.
References
Wickham, H. (2016). ggplot2: Elegant Graphics for Data Analysis (Use R!). Second Edition. Springer.
Note
The function stat_test_text is called by the function geom_stripchart.
See also
Examples
# First, load and attach the ggplot2 package.
#--------------------------------------------
library(ggplot2)
#==========
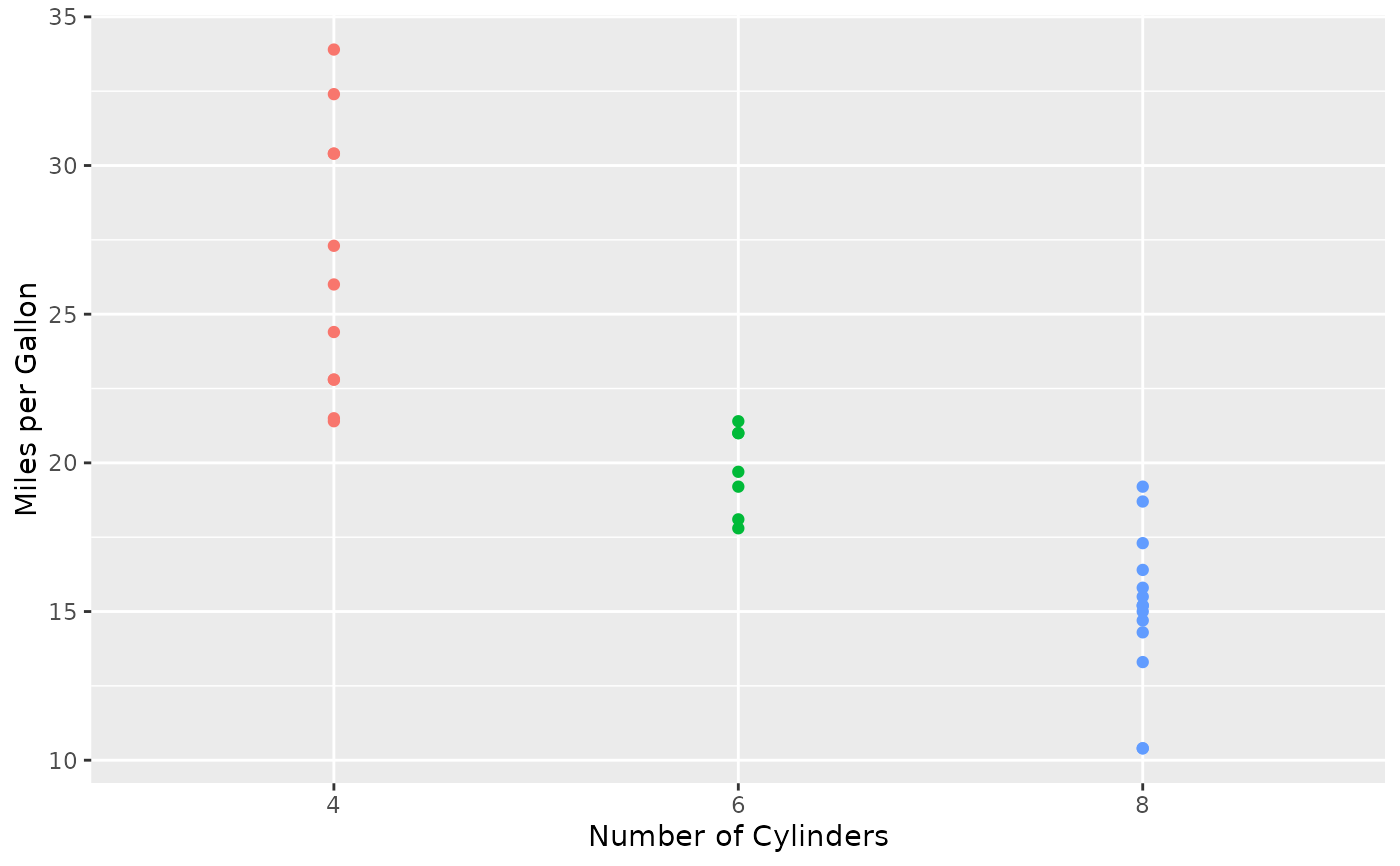
# Example 1:
# Using the built-in data frame mtcars,
# plot miles per gallon vs. number of cylinders
# using different colors for each level of the number of cylinders.
#------------------------------------------------------------------
p <- ggplot(mtcars, aes(x = factor(cyl), y = mpg, color = factor(cyl))) +
theme(legend.position = "none")
p + geom_point(show.legend = FALSE) +
labs(x = "Number of Cylinders", y = "Miles per Gallon")
 # Now add text indicating the sample size and
# mean and standard deviation for each level of cylinder, and
# test for the difference in means between groups.
#------------------------------------------------------------
dev.new()
p + geom_point() +
stat_n_text() + stat_mean_sd_text() +
stat_test_text() +
labs(x = "Number of Cylinders", y = "Miles per Gallon")
#==========
# Example 2:
# Repeat Example 1, but show text indicating the median and IQR,
# and use the nonparametric test.
#---------------------------------------------------------------
dev.new()
p + geom_point() +
stat_n_text() + stat_median_iqr_text() +
stat_test_text(test = "nonparametric") +
labs(x = "Number of Cylinders", y = "Miles per Gallon")
#==========
# Example 3:
# Repeat Example 1, but use only the groups with
# 4 and 8 cylinders.
#-----------------------------------------------
p <- ggplot(subset(mtcars, cyl %in% c(4, 8)),
aes(x = factor(cyl), y = mpg, color = cyl)) +
theme(legend.position = "none")
dev.new()
p + geom_point() +
stat_n_text() + stat_mean_sd_text() +
stat_test_text() +
labs(x = "Number of Cylinders", y = "Miles per Gallon")
#==========
# Example 4:
# Repeat Example 3, but
# 1) facet by transmission type,
# 2) make the text smaller,
# 3) put the text for the test results in a text box
# and make them blue.
#---------------------------------------------------
dev.new()
p + geom_point() +
stat_n_text(size = 3) + stat_mean_sd_text(size = 3) +
stat_test_text(size = 3, text.box = TRUE, color = "blue") +
facet_wrap(~ am, labeller = label_both) +
labs(x = "Number of Cylinders", y = "Miles per Gallon")
#==========
# Clean up
#---------
graphics.off()
rm(p)
# Now add text indicating the sample size and
# mean and standard deviation for each level of cylinder, and
# test for the difference in means between groups.
#------------------------------------------------------------
dev.new()
p + geom_point() +
stat_n_text() + stat_mean_sd_text() +
stat_test_text() +
labs(x = "Number of Cylinders", y = "Miles per Gallon")
#==========
# Example 2:
# Repeat Example 1, but show text indicating the median and IQR,
# and use the nonparametric test.
#---------------------------------------------------------------
dev.new()
p + geom_point() +
stat_n_text() + stat_median_iqr_text() +
stat_test_text(test = "nonparametric") +
labs(x = "Number of Cylinders", y = "Miles per Gallon")
#==========
# Example 3:
# Repeat Example 1, but use only the groups with
# 4 and 8 cylinders.
#-----------------------------------------------
p <- ggplot(subset(mtcars, cyl %in% c(4, 8)),
aes(x = factor(cyl), y = mpg, color = cyl)) +
theme(legend.position = "none")
dev.new()
p + geom_point() +
stat_n_text() + stat_mean_sd_text() +
stat_test_text() +
labs(x = "Number of Cylinders", y = "Miles per Gallon")
#==========
# Example 4:
# Repeat Example 3, but
# 1) facet by transmission type,
# 2) make the text smaller,
# 3) put the text for the test results in a text box
# and make them blue.
#---------------------------------------------------
dev.new()
p + geom_point() +
stat_n_text(size = 3) + stat_mean_sd_text(size = 3) +
stat_test_text(size = 3, text.box = TRUE, color = "blue") +
facet_wrap(~ am, labeller = label_both) +
labs(x = "Number of Cylinders", y = "Miles per Gallon")
#==========
# Clean up
#---------
graphics.off()
rm(p)